We are missing one important variable that affects Calorie_Burnage, which is the Duration of the training session.
Duration in combination with Average_Pulse will together explain Calorie_Burnage more precisely.
Linear Regression
The term regression is used when you try to find the relationship between variables.
In Machine Learning and in statistical modeling, that relationship is used to predict the outcome of events.
In this module, we will cover the following questions:
- Can we conclude that Average_Pulse and Duration are related to Calorie_Burnage?
- Can we use Average_Pulse and Duration to predict Calorie_Burnage?
Least Square Method
Linear regression uses the least square method.
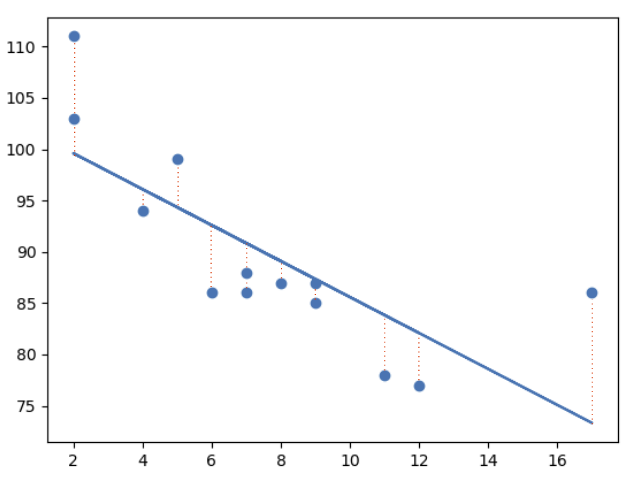
The concept is to draw a line through all the plotted data points. The line is positioned in a way that it minimizes the distance to all of the data points.
The distance is called "residuals" or "errors".
The red dashed lines represents the distance from the data points to the drawn mathematical function.
Linear Regression Using One Explanatory Variable
In this example, we will try to predict Calorie_Burnage with Average_Pulse using Linear Regression:
Example
import pandas as pd
import matplotlib.pyplot as plt
from scipy
import stats

full_health_data = pd.read_csv("data.csv", header=0, sep=",")

x = full_health_data["Average_Pulse"]
y = full_health_data ["Calorie_Burnage"]

slope, intercept, r, p, std_err = stats.linregress(x, y)

def myfunc(x):
 return
slope * x + intercept

mymodel = list(map(myfunc, x))

plt.scatter(x, y)
plt.plot(x, slope * x + intercept)
plt.ylim(ymin=0, ymax=2000)
plt.xlim(xmin=0, xmax=200)
plt.xlabel("Average_Pulse")
plt.ylabel ("Calorie_Burnage")
plt.show()
Example Explained:
- Import the modules you need: Pandas, matplotlib and Scipy
- Isolate Average_Pulse as x. Isolate Calorie_burnage as y
- Get important key values with: slope, intercept, r, p, std_err = stats.linregress(x, y)
- Create a function that uses the slope and intercept values to return a new value. This new value represents where on the y-axis the corresponding x value will be placed
- Run each value of the x array through the function. This will result in a new array with new values for the y-axis: mymodel = list(map(myfunc, x))
- Draw the original scatter plot: plt.scatter(x, y)
- Draw the line of linear regression: plt.plot(x, mymodel)
- Define maximum and minimum values of the axis
- Label the axis: "Average_Pulse" and "Calorie_Burnage"
Output:
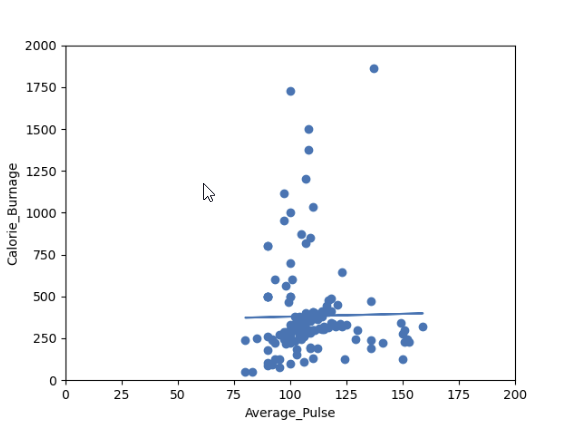
Note: Do you think that the line is able to predict Calorie_Burnage precisely? We will show that the variable Average_Pulse alone is not enough to make precise prediction of Calorie_Burnage.
