The Sports Watch Data Set
Take a look at our health data set:
| Duration | Average_Pulse | Max_Pulse | Calorie_Burnage | Hours_Work | Hours_Sleep |
|---|---|---|---|---|---|
| 30 | 80 | 120 | 240 | 10 | 7 |
| 30 | 85 | 120 | 250 | 10 | 7 |
| 45 | 90 | 130 | 260 | 8 | 7 |
| 45 | 95 | 130 | 270 | 8 | 7 |
| 45 | 100 | 140 | 280 | 0 | 7 |
| 60 | 105 | 140 | 290 | 7 | 8 |
| 60 | 110 | 145 | 300 | 7 | 8 |
| 60 | 115 | 145 | 310 | 8 | 8 |
| 75 | 120 | 150 | 320 | 0 | 8 |
| 75 | 125 | 150 | 330 | 8 | 8 |
Plot the Existing Data in Python
Now, we can first plot the values of Average_Pulse against Calorie_Burnage using the matplotlib library.
The plot() function is used to make a 2D hexagonal binning plot of points x,y:
Example
  import matplotlib.pyplot as plt

health_data.plot(x ='Average_Pulse',
  y='Calorie_Burnage', kind='line'),
plt.ylim(ymin=0)
plt.xlim(xmin=0)

plt.show()
Example Explained
- Import the pyplot module of the matplotlib library
- Plot the data from Average_Pulse against Calorie_Burnage
kind='line'tells us which type of plot we want. Here, we want to have a straight line- plt.ylim() and plt.xlim() tells us what value we want the axis to start on. Here, we want the axis to begin from zero
- plt.show() shows us the output
The code above will produce the following result:
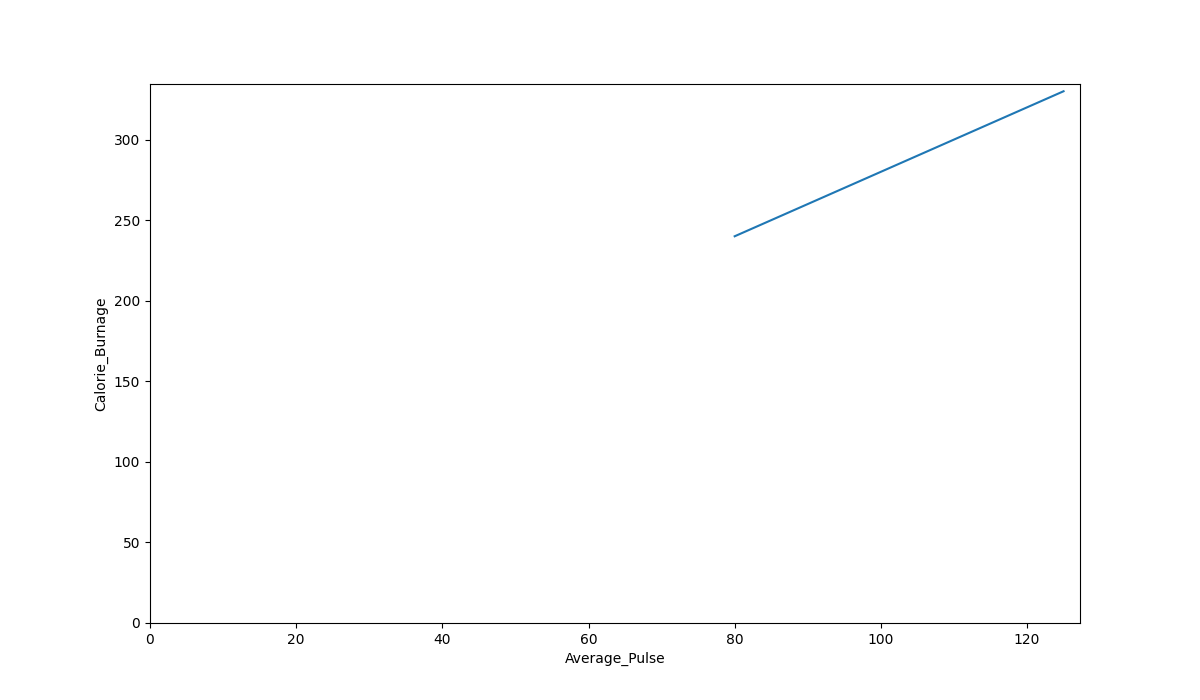
The Graph Output
As we can see, there is a relationship between Average_Pulse and Calorie_Burnage. Calorie_Burnage increases proportionally with Average_Pulse. It means that we can use Average_Pulse to predict Calorie_Burnage.
Why is The Line Not Fully Drawn Down to The y-axis?
The reason is that we do not have observations where Average_Pulse or Calorie_Burnage are equal to zero. 80 is the first observation of Average_Pulse and 240 is the first observation of Calorie_Burnage.
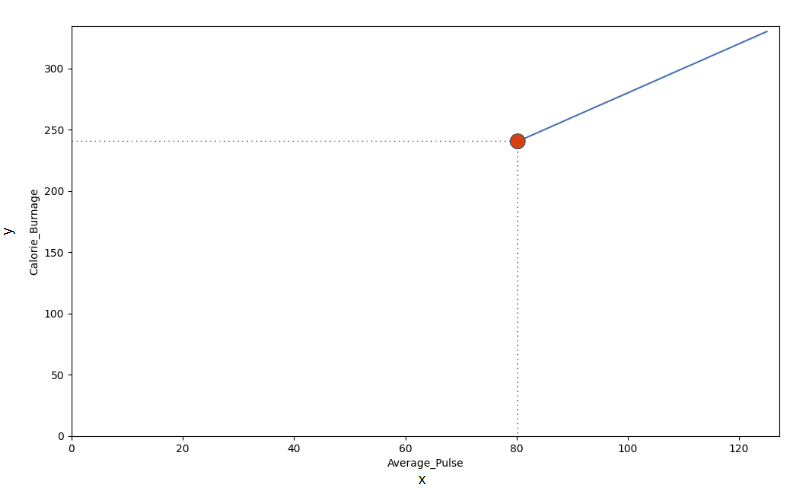
Look at the line. What happens to calorie burnage if average pulse increases from 80 to 90?
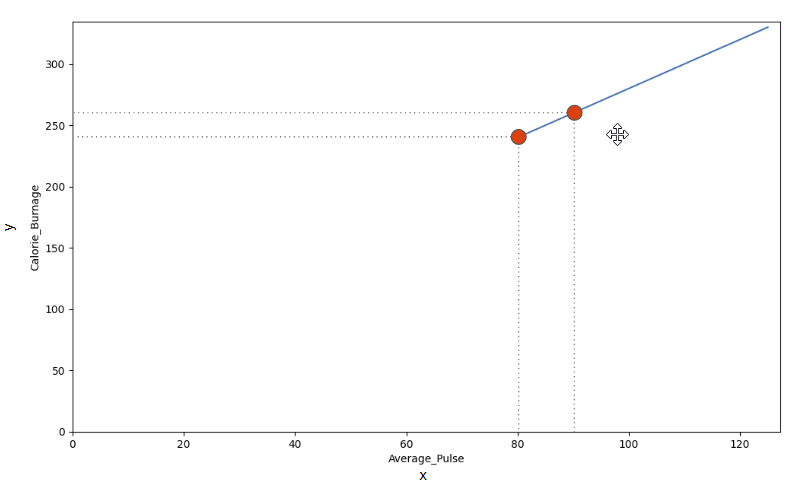
We can use the diagonal line to find the mathematical function to predict calorie burnage.
As it turns out:
- If the average pulse is 80, the calorie burnage is 240
- If the average pulse is 90, the calorie burnage is 260
- If the average pulse is 100, the calorie burnage is 280
There is a pattern. If average pulse increases by 10, the calorie burnage increases by 20.
