The "Statistics of the Coefficients Part" in Regression Table
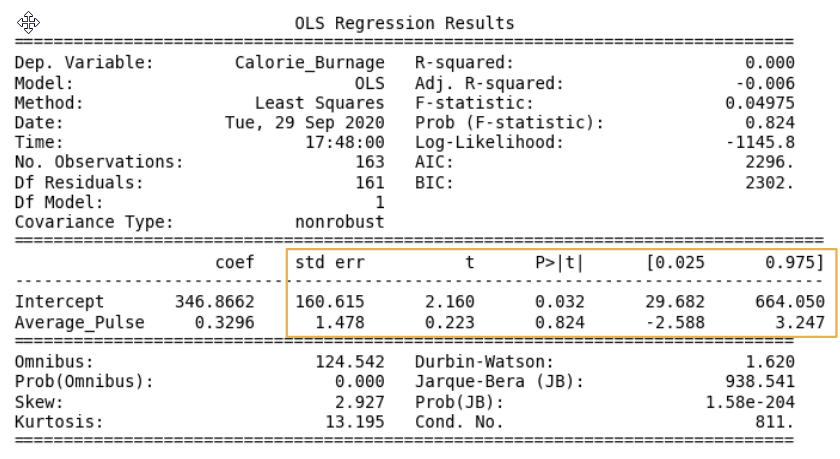
Now, we want to test if the coefficients from the linear regression function has a significant impact on the dependent variable (Calorie_Burnage).
This means that we want to prove that it exists a relationship between Average_Pulse and Calorie_Burnage, using statistical tests.
There are four components that explains the statistics of the coefficients:
- std err stands for Standard Error
- t is the "t-value" of the coefficients
- P>|t| is called the "P-value"
- [0.025 0.975] represents the confidence interval of the coefficients
We will focus on understanding the "P-value" in this module.
The P-value
The P-value is a statistical number to conclude if there is a relationship between Average_Pulse and Calorie_Burnage.
We test if the true value of the coefficient is equal to zero (no relationship). The statistical test for this is called Hypothesis testing.
- A low P-value (< 0.05) means that the coefficient is likely not to equal zero.
- A high P-value (> 0.05) means that we cannot conclude that the explanatory variable affects the dependent variable (here: if Average_Pulse affects Calorie_Burnage).
- A high P-value is also called an insignificant P-value.
Hypothesis Testing
Hypothesis testing is a statistical procedure to test if your results are valid.
In our example, we are testing if the true coefficient of Average_Pulse and the intercept is equal to zero.
Hypothesis test has two statements. The null hypothesis and the alternative hypothesis.
- The null hypothesis can be shortly written as H0
- The alternative hypothesis can be shortly written as HA
Mathematically written:
  H0: Average_Pulse = 0
HA: Average_Pulse ≠ 0
H0: Intercept =
0
HA: Intercept ≠ 0
The sign ≠ means "not equal to"
Hypothesis Testing and P-value
The null hypothesis can either be rejected or not.
If we reject the null hypothesis, we conclude that it exist a relationship between Average_Pulse and Calorie_Burnage. The P-value is used for this conclusion.
A common threshold of the P-value is 0.05.
Note: A P-value of 0.05 means that 5% of the times, we will falsely reject the null hypothesis. It means that we accept that 5% of the times, we might falsely have concluded a relationship.
If the P-value is lower than 0.05, we can reject the null hypothesis and conclude that it exist a relationship between the variables.
However, the P-value of Average_Pulse is 0.824. So, we cannot conclude a relationship between Average_Pulse and Calorie_Burnage.
It means that there is a 82.4% chance that the true coefficient of Average_Pulse is zero.
The intercept is used to adjust the regression function's ability to predict more precisely. It is therefore uncommon to interpret the P-value of the intercept.
