Logistic Distribution
Logistic Distribution is used to describe growth.
Used extensively in machine learning in logistic regression, neural networks etc.
It has three parameters:
loc - mean, where the peak is. Default 0.
scale - standard deviation, the flatness of distribution. Default 1.
size - The shape of the returned array.
Example
  from numpy import random

x = random.logistic(loc=1, scale=2, size=(2,
  3))

print(x)
Visualization of Logistic Distribution
Example
  from numpy import random
import matplotlib.pyplot as plt
import seaborn as sns

sns.displot(random.logistic(size=1000), kind="kde")

plt.show()

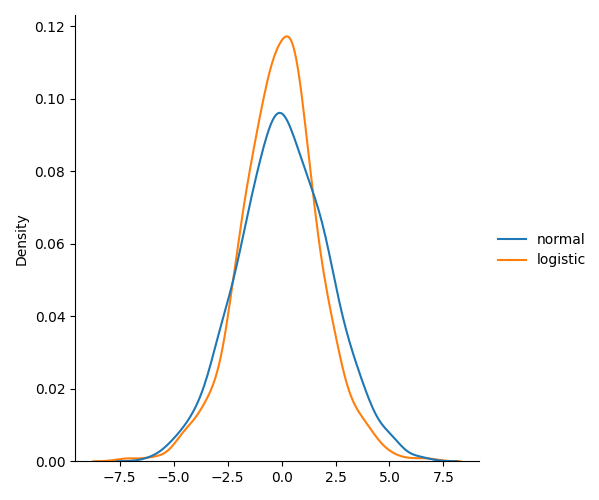
Difference Between Logistic and Normal Distribution
Both distributions are near identical, but logistic distribution has more area under the tails, meaning it represents more possibility of occurrence of an event further away from mean.
For higher value of scale (standard deviation) the normal and logistic distributions are near identical apart from the peak.
Example
from numpy import random
import matplotlib.pyplot as plt
import seaborn as sns

data = {
  "normal": random.normal(scale=2, size=1000),

"logistic": random.logistic(size=1000)
}

sns.displot(data, kind="kde")

plt.show()