Visualize Distributions With Seaborn
Seaborn is a library that uses Matplotlib underneath to plot graphs. It will be used to visualize random distributions.
Install Seaborn.
If you have Python and PIP already installed on a system, install it using this command:
C:\Users\Your Name>pip install seaborn
If you use Jupyter, install Seaborn using this command:
C:\Users\Your Name>!pip install seaborn
Displots
Displot stands for distribution plot, it takes as input an array and plots a curve corresponding to the distribution of points in the array.
Import Matplotlib
import matplotlib.pyplot as plt
You can learn about the Matplotlib module in our Matplotlib Tutorial.
Import Seaborn
import seaborn as sns
Plotting a Displot
Example
  import matplotlib.pyplot as plt
import seaborn as sns

sns.displot([0, 1,
  2, 3, 4, 5])

  plt.show()
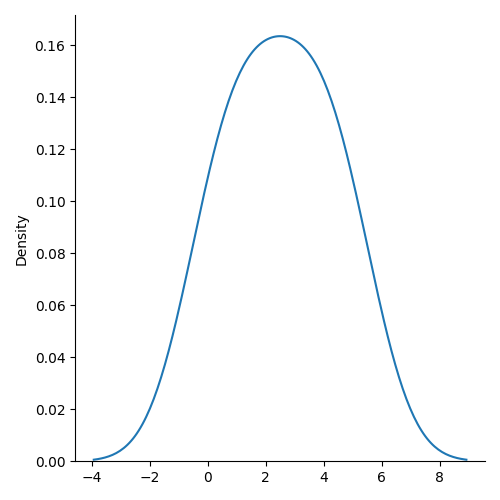
Plotting a Displot Without the Histogram
Example
  import matplotlib.pyplot as plt
import seaborn as sns

sns.displot([0, 1,
  2, 3, 4, 5], kind="kde")

  plt.show()
Note: We will be using:
sns.displot(arr, kind="kde")to visualize random distributions in this tutorial.
