
K-means
K-means is an unsupervised learning method for clustering data points. The algorithm iteratively divides data points into K clusters by minimizing the variance in each cluster.
Here, we will show you how to estimate the best value for K using the elbow method, then use K-means clustering to group the data points into clusters.
How does it work?
First, each data point is randomly assigned to one of the K clusters. Then, we compute the centroid (functionally the center) of each cluster, and reassign each data point to the cluster with the closest centroid. We repeat this process until the cluster assignments for each data point are no longer changing.
K-means clustering requires us to select K, the number of clusters we want to group the data into. The elbow method lets us graph the inertia (a distance-based metric) and visualize the point at which it starts decreasing linearly. This point is referred to as the "elbow" and is a good estimate for the best value for K based on our data.
Example
  import matplotlib.pyplot as plt

x = [4, 5, 10, 4,
  3, 11, 14 , 6, 10, 12]
y = [21, 19, 24, 17, 16, 25, 24, 22, 21, 21]

  plt.scatter(x, y)
plt.show()
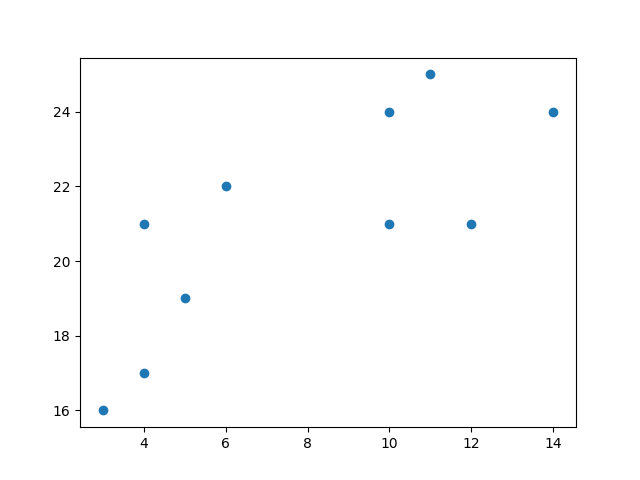
Now we utilize the elbow method to visualize the intertia for different values of K:
Example
from sklearn.cluster import KMeans

data = list(zip(x, y))
inertias = []

for i in range(1,11):
    kmeans = KMeans(n_clusters=i)
    kmeans.fit(data)
    inertias.append(kmeans.inertia_)

plt.plot(range(1,11), inertias, marker='o')
plt.title('Elbow method')
plt.xlabel('Number of clusters')
plt.ylabel('Inertia')
plt.show()
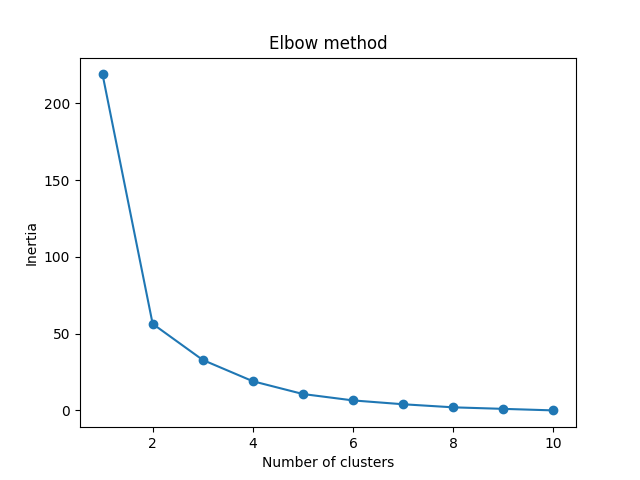
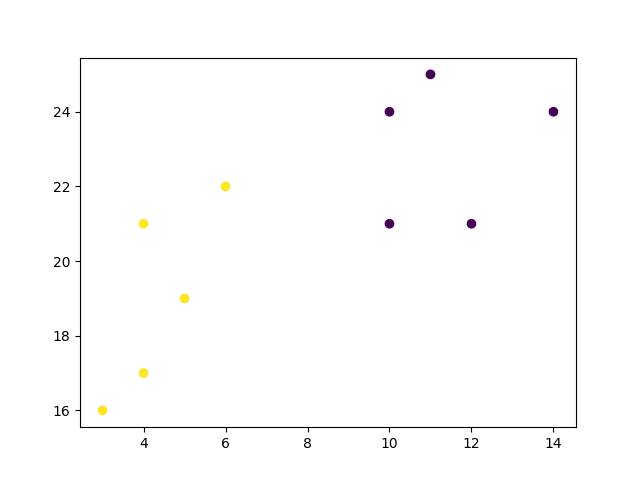
The elbow method shows that 2 is a good value for K, so we retrain and visualize the result:
Example
kmeans = KMeans(n_clusters=2)
kmeans.fit(data)

plt.scatter(x, y, c=kmeans.labels_)
plt.show()
Example Explained
Import the modules you need.
<p><code class="pythonHigh">import matplotlib.pyplot as plt<br/>
from sklearn.cluster import KMeans</code></p>
You can learn about the Matplotlib module in our "Matplotlib Tutorial.
scikit-learn is a popular library for machine learning.
Create arrays that resemble two variables in a dataset. Note that while we only use two variables here, this method will work with any number of variables:
<p><code class="pythonHigh">x = [4, 5, 10, 4, 3, 11, 14 , 6, 10, 12]<br/>
y = [21, 19, 24, 17, 16, 25, 24, 22, 21, 21]
</code></p>
Turn the data into a set of points:
<p><code class="pythonHigh">data = list(zip(x, y))<br/>
print(data)</code></p>
Result:
<p><code class="pythonHigh">[(4, 21), (5, 19), (10, 24), (4, 17), (3, 16), (11, 25), (14, 24), (6, 22), (10, 21), (12, 21)]
</code></p>
In order to find the best value for K, we need to run K-means across our data for a range of possible values. We only have 10 data points, so the maximum number of clusters is 10. So for each value K in range(1,11), we train a K-means model and plot the intertia at that number of clusters:
<p><code class="pythonHigh">inertias = []<br/>
<br/>
for i in range(1,11):<br/>
    kmeans = KMeans(n_clusters=i)<br/>
    kmeans.fit(data)<br/>
    inertias.append(kmeans.inertia_)<br/>
<br/>
plt.plot(range(1,11), inertias, marker='o')<br/>
plt.title('Elbow method')<br/>
plt.xlabel('Number of clusters')<br/>
plt.ylabel('Inertia')<br/>
plt.show()
</code></p>
Result:
We can see that the "elbow" on the graph above (where the interia becomes more linear) is at K=2. We can then fit our K-means algorithm one more time and plot the different clusters assigned to the data:
<p><code class="pythonHigh">kmeans = KMeans(n_clusters=2)<br/>
kmeans.fit(data)<br/>
<br/>
plt.scatter(x, y, c=kmeans.labels_)<br/>
plt.show()</code></p>
Result:
