
Linestyle
You can use the keyword argument linestyle, or shorter ls, to change the style of the plotted line:
Example
import matplotlib.pyplot as plt
import numpy as np

ypoints = np.array([3, 8, 1, 10])

plt.plot(ypoints, linestyle = 'dotted')
plt.show()

Example
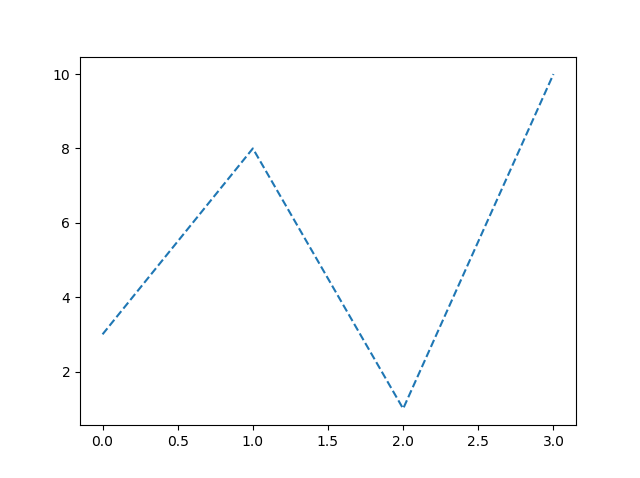
plt.plot(ypoints, linestyle = 'dashed')
Shorter Syntax
The line style can be written in a shorter syntax:
linestyle can be written as ls.
dotted can be written as :.
dashed can be written as --.
Example
plt.plot(ypoints, ls = ':')
Line Styles
You can choose any of these styles:
| Style | Or |
|---|---|
| 'solid' (default) | '-' |
| 'dotted' | ':' |
| 'dashed' | '--' |
| 'dashdot' | '-.' |
| 'None' | '' or ' ' |
Line Color
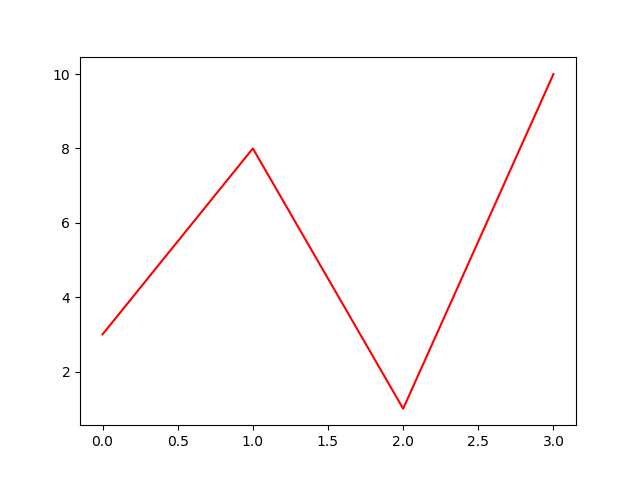
You can use the keyword argument color or the shorter c to set the color of the line:
Example
import matplotlib.pyplot as plt
import numpy as np

ypoints = np.array([3, 8, 1, 10])

plt.plot(ypoints, color = 'r')
plt.show()
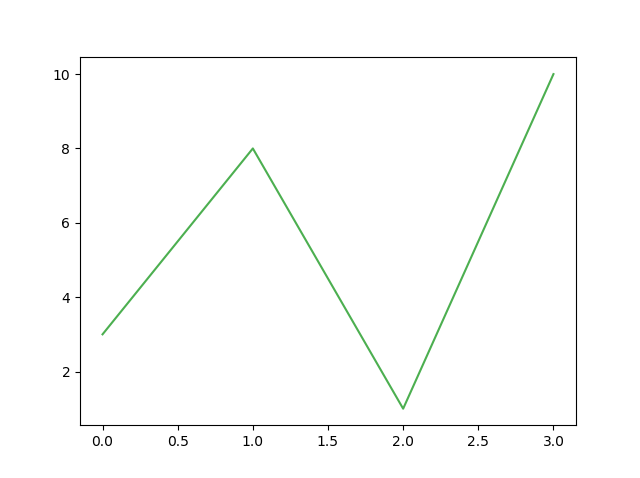
You can also use Hexadecimal color values:
Example
...

plt.plot(ypoints, c = '#4CAF50')
...
Or any of the 140 supported color names.
Example
...

plt.plot(ypoints, c = 'hotpink')
...

Line Width
You can use the keyword argument linewidth or the shorter lw to change the width of the line.
The value is a floating number, in points:
Example
import matplotlib.pyplot as plt
import numpy as np

ypoints = np.array([3, 8, 1, 10])

plt.plot(ypoints, linewidth = '20.5')
plt.show()

Multiple Lines
You can plot as many lines as you like by simply adding more plt.plot() functions:
Example
import matplotlib.pyplot as plt
import numpy as np

y1 = np.array([3, 8, 1, 10])
y2 = np.array([6, 2, 7, 11])

plt.plot(y1)
plt.plot(y2)

plt.show()

You can also plot many lines by adding the points for the x- and y-axis for each line in the same plt.plot() function.
(In the examples above we only specified the points on the y-axis, meaning that the points on the x-axis got the the default values (0, 1, 2, 3).)
The x- and y- values come in pairs:
Example
import matplotlib.pyplot as plt
import numpy as np

x1 = np.array([0, 1, 2, 3])
y1 = np.array([3, 8, 1, 10])
x2 = np.array([0, 1, 2, 3])
y2 = np.array([6, 2, 7, 11])

plt.plot(x1, y1, x2, y2)
plt.show()
