Markers
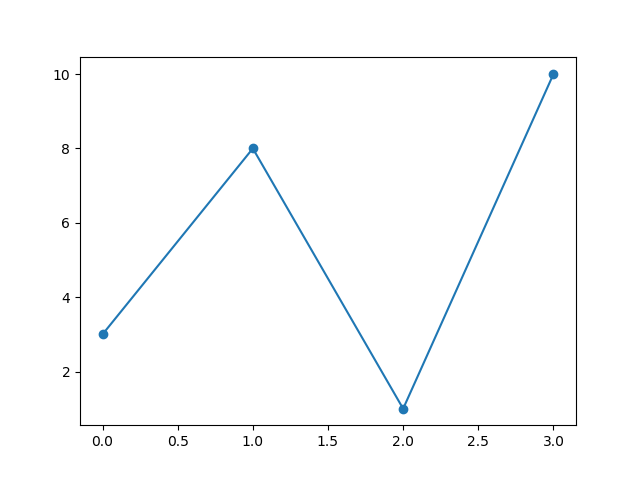
You can use the keyword argument marker to emphasize each point with a specified marker:
Example
import matplotlib.pyplot as plt
import numpy as np

ypoints = np.array([3, 8, 1, 10])

plt.plot(ypoints, marker = 'o')
plt.show()
Example
...

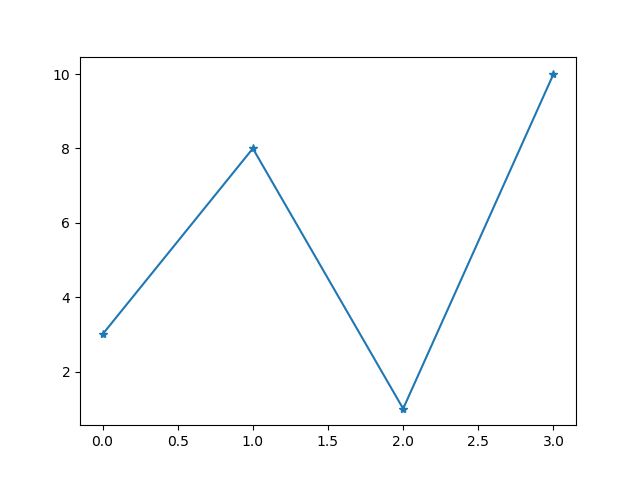
plt.plot(ypoints, marker = '*')
...
Marker Reference
You can choose any of these markers:
| Marker | Description |
|---|---|
| 'o' | Circle |
| '*' | Star |
| '.' | Point |
| ',' | Pixel |
| 'x' | X |
| 'X' | X (filled) |
| '+' | Plus |
| 'P' | Plus (filled) |
| 's' | Square |
| 'D' | Diamond |
| 'd' | Diamond (thin) |
| 'p' | Pentagon |
| 'H' | Hexagon |
| 'h' | Hexagon |
| 'v' | Triangle Down |
| '^' | Triangle Up |
| '<' | Triangle Left |
| '>' | Triangle Right |
| '1' | Tri Down |
| '2' | Tri Up |
| '3' | Tri Left |
| '4' | Tri Right |
| '|' | Vline |
| '_' | Hline |
Format Strings fmt
You can also use the shortcut string notation parameter to specify the marker.
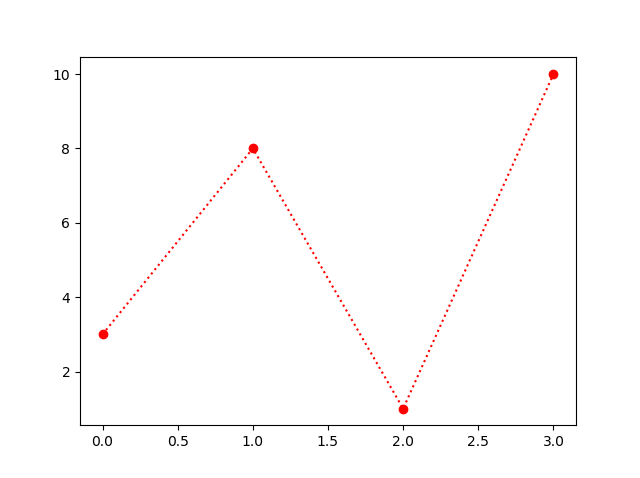
This parameter is also called fmt, and is written with this syntax:
Example
import matplotlib.pyplot as plt
import numpy as np

ypoints = np.array([3, 8, 1, 10])

plt.plot(ypoints, 'o:r')
plt.show()
The marker value can be anything from the Marker Reference above.
The line value can be one of the following:
Line Reference
| Line Syntax | Description |
|---|---|
| '-' | Solid line |
| ':' | Dotted line |
| '--' | Dashed line |
| '-.' | Dashed/dotted line |
Note: If you leave out the line value in the fmt parameter, no line will be plotted.
The short color value can be one of the following:
Color Reference
| Color Syntax | Description |
|---|---|
| 'r' | Red |
| 'g' | Green |
| 'b' | Blue |
| 'c' | Cyan |
| 'm' | Magenta |
| 'y' | Yellow |
| 'k' | Black |
| 'w' | White |
Marker Size
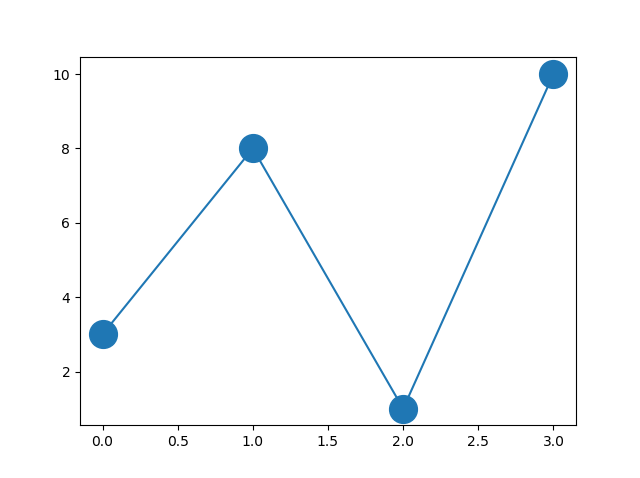
You can use the keyword argument markersize or the shorter version, ms to set the size of the markers:
Example
import matplotlib.pyplot as plt
import numpy as np

ypoints = np.array([3, 8, 1, 10])

plt.plot(ypoints, marker = 'o', ms = 20)
plt.show()
Marker Color
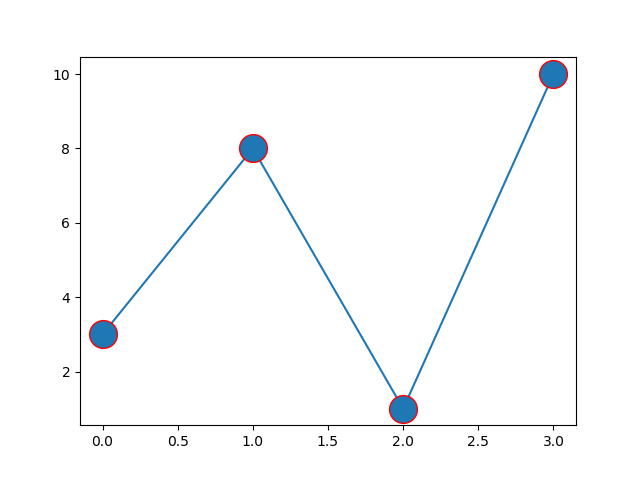
You can use the keyword argument markeredgecolor or the shorter mec to set the color of the edge of the markers:
Example
import matplotlib.pyplot as plt
import numpy as np

ypoints = np.array([3, 8, 1, 10])

plt.plot(ypoints, marker = 'o', ms = 20, mec = 'r')
plt.show()
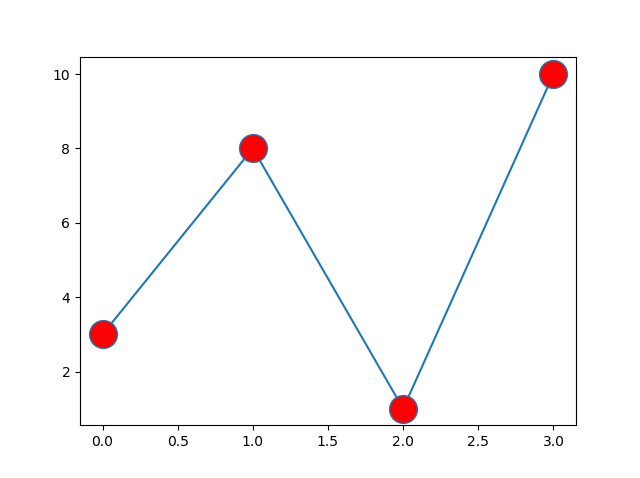
You can use the keyword argument markerfacecolor or the shorter mfc to set the color inside the edge of the markers:
Example
import matplotlib.pyplot as plt
import numpy as np

ypoints = np.array([3, 8, 1, 10])

plt.plot(ypoints, marker = 'o', ms = 20, mfc = 'r')
plt.show()
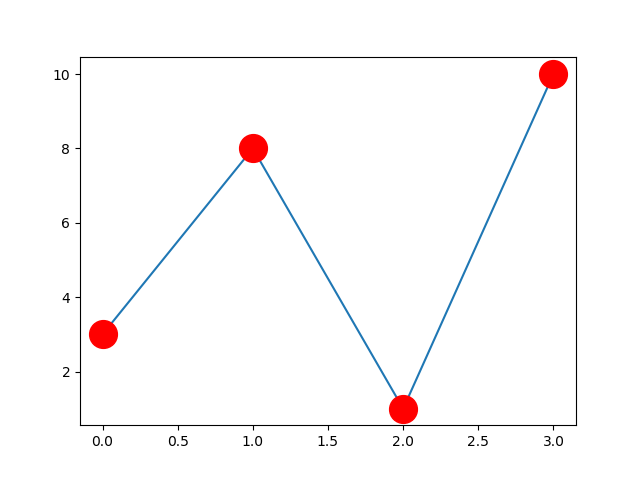
Use both the mec and mfc arguments to color the entire marker:
Example
import matplotlib.pyplot as plt
import numpy as np

ypoints = np.array([3, 8, 1, 10])

plt.plot(ypoints, marker = 'o', ms = 20, mec = 'r', mfc = 'r')
plt.show()
You can also use Hexadecimal color values:
Example
...

plt.plot(ypoints, marker = 'o', ms = 20, mec = '#4CAF50', mfc = '#4CAF50')
...
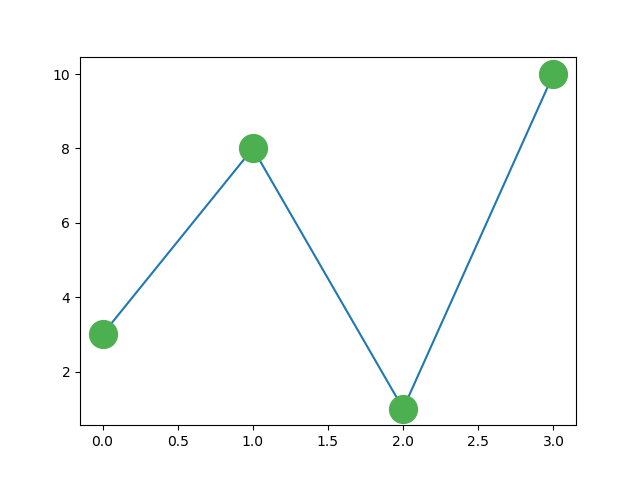
Or any of the 140 supported color names.
Example
...

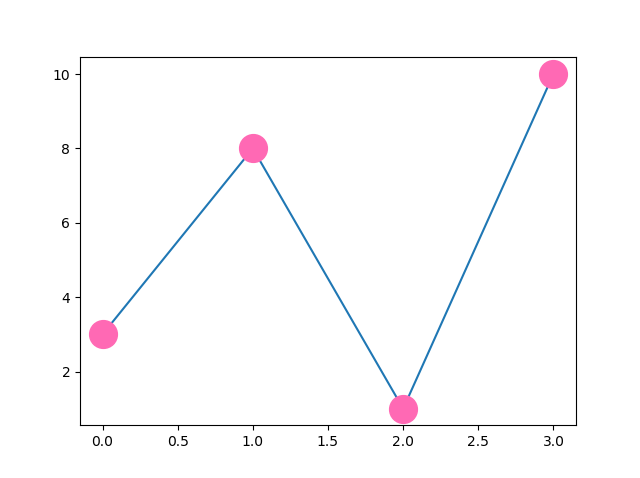
plt.plot(ypoints, marker = 'o', ms = 20, mec = 'hotpink', mfc = 'hotpink')
...