
Creating Bars
With Pyplot, you can use the bar() function to draw bar graphs:
Example
  import matplotlib.pyplot as plt
import numpy as np

x = np.array(["A",
  "B", "C", "D"])
y = np.array([3, 8, 1, 10])

plt.bar(x,y)
plt.show()
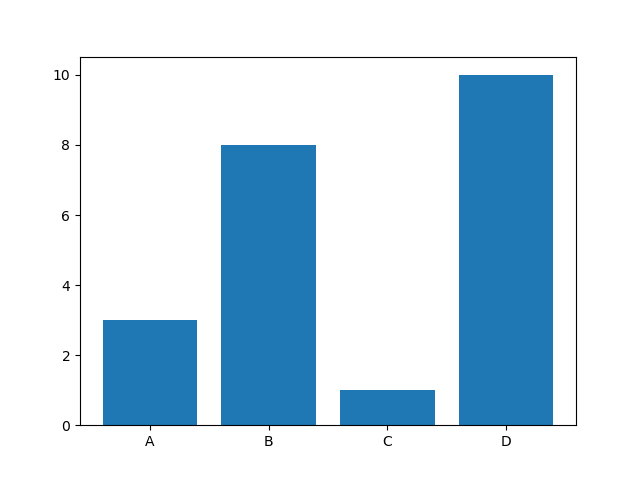
The bar() function takes arguments that describes the layout of the bars.
The categories and their values represented by the first and second argument as arrays.
Example
x = ["APPLES", "BANANAS"]
y = [400, 350]
plt.bar(x, y)
Horizontal Bars
If you want the bars to be displayed horizontally instead of vertically, use the barh() function:
Example
  import matplotlib.pyplot as plt
import numpy as np

x = np.array(["A",
  "B", "C", "D"])
y = np.array([3, 8, 1, 10])

plt.barh(x, y)
plt.show()

Bar Color
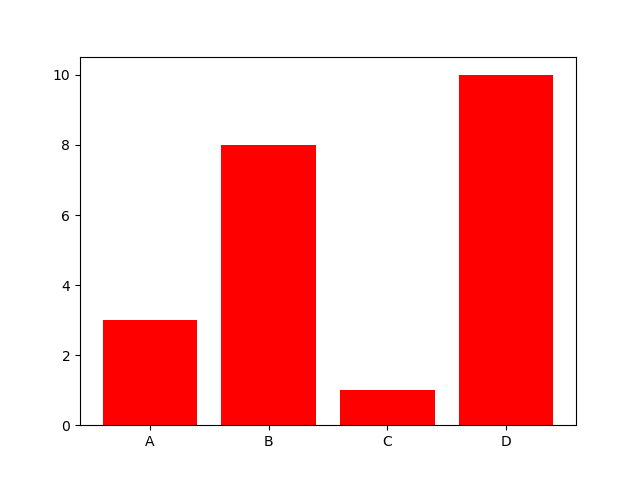
The bar() and barh() take the keyword argument color to set the color of the bars:
Example
  import matplotlib.pyplot as plt
import numpy as np

x = np.array(["A",
  "B", "C", "D"])
y = np.array([3, 8, 1, 10])

plt.bar(x, y, color = "red")
plt.show()
Color Names
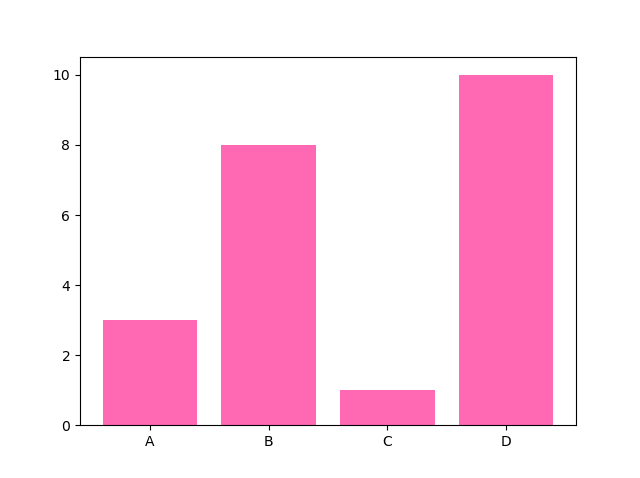
You can use any of the 140 supported color names.
Example
  import matplotlib.pyplot as plt
import numpy as np

x = np.array(["A",
  "B", "C", "D"])
y = np.array([3, 8, 1, 10])

plt.bar(x, y, color = "hotpink")
plt.show()
Color Hex
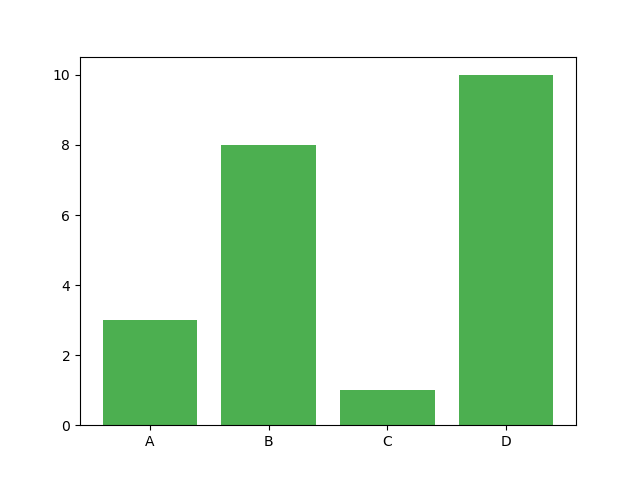
Or you can use Hexadecimal color values:
Example
  import matplotlib.pyplot as plt
import numpy as np

x = np.array(["A",
  "B", "C", "D"])
y = np.array([3, 8, 1, 10])

plt.bar(x, y, color = "#4CAF50")
plt.show()
Bar Width
The bar() takes the keyword argument width to set the width of the bars:
Example
  import matplotlib.pyplot as plt
import numpy as np

x = np.array(["A",
  "B", "C", "D"])
y = np.array([3, 8, 1, 10])

plt.bar(x, y, width = 0.1)
plt.show()
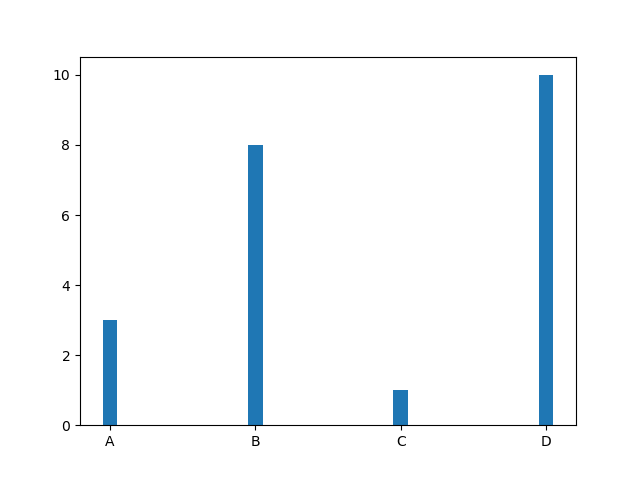
The default width value is 0.8
Note: For horizontal bars, use
heightinstead ofwidth.
Bar Height
The barh() takes the keyword argument height to set the height of the bars:
Example
  import matplotlib.pyplot as plt
import numpy as np

x = np.array(["A",
  "B", "C", "D"])
y = np.array([3, 8, 1, 10])

plt.barh(x, y, height = 0.1)
plt.show()
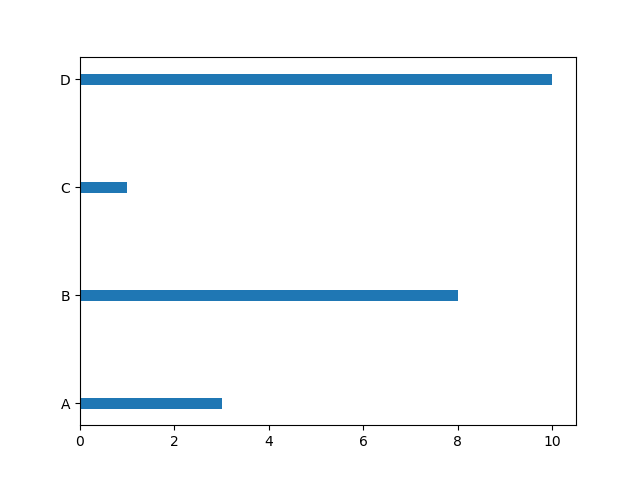
The default height value is 0.8
